


July 23rd Chart Decoder Series: VWAP – Market Truth Detector
In education
Welcome to the Chart Decoder series. Here we categorize tools that separate casual traders from professionals.
You have already mastered trend identification (SMA/EMA), momentum shift (MACD), excessive/sold out zones (RSI), extreme extreme extremes (bollinger bands), and inversion timing (probability).
Now it’s time for VWAP, an indicator that cuts Now and tells you one simple thing. Are you overpaying?
What is VWAP?
VWAP represents the volume weighted average price. It shows you the average price everyone paid today, but gives you more weight to the price where many transactions have happened.
Bitcoin spiked quickly to $110,000, but only a few people bought there, most people traded about $105,000 on a major buying and selling, while VWAP is way closer to $105,000.
The concept of calculation is simple.
- Do all trades all day
- Multiply the price x volume for each transaction
- Add them all and split them by total amount
What you get is a “true” average price that reflects where most of the money actually changed hands.
How to read VWAP:
vwap above = pay more than most people. If the price exceeds VWAP, most people are paying more than what they paid today (weighted by the amount they bought). This means:
- Many people are buying it now and are increasing the price
- You may be purchasing when the price is temporarily high
- Prices may return to where most people bought it
Below vwap = get better deals. If the price is below VWAP, most people get a better price than what they paid today. This often means:
- More people sell it than they buy, pushing prices down
- You may have gotten quite a deal compared to previous buyers
- Prices may bounce back to where most people bought it
VWAP = Pay average. When a price is traded on VWAP, the average person pays exactly what he pays today, based on all the buy and sell that occurred.
Large traders use VWAP to benchmark trading. This is why VWAP often acts as support or resistance. Institutional algorithms are programmed to protect these levels.
Actual example: Bitfinex’s BTC/USD
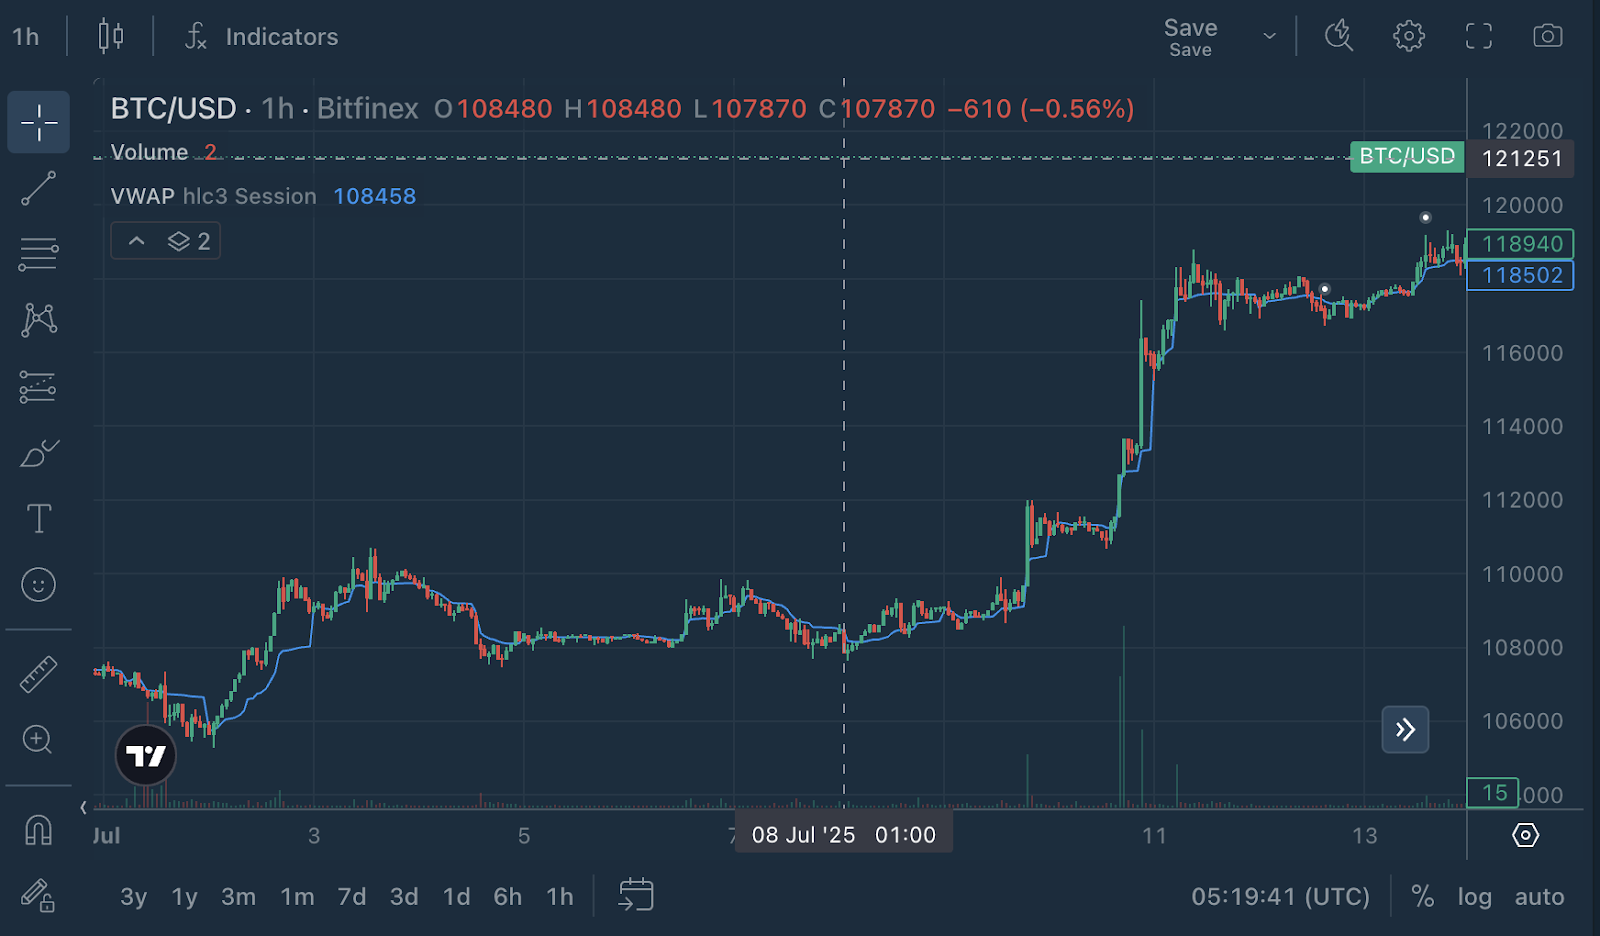
- price: $118,940
- VWAP: $118,502
Bitcoin trades for around $438, beyond VWAP. Mild Premium region.
Transactions above VWAP typically show bullish momentum. This means that the average buyer for this session is profitable. This is a strong indicator that demand is currently outweighing supply. However, premiums are not over-excessive, suggesting that movement is still measured rather than euphoric. Several dynamics may be at work:
- Buyers are in controlbut not aggressive. It is a sign of healthy and stable accumulation.
- VWAP may act as dynamic support. If prices recede, the VWAP line could be around $118,502, at a level where buyers would recede.
- There is no clear discount It exists at this point. Traders looking for bargain entries are advised to wait for a potential retest of VWAP.
in short, Bitcoin is currently in a balanced but bullish positionand traders may want to see how prices behave around VWAP and measure whether this move has more legs or is time for breath.
VWAP + Other Indicators: Power Combo
VWAP works even better when combined with other tools.
VWAP + RSI:If the price exceeds VWAP and The RSI shows what was forced to buy. This is a powerful signal you might buy at a temporary peak.
VWAP + Volume: As prices increase volume and approach VWAP, they often show significant levels. Large players may be defending or testing this “fair value” line.
VWAP + Support/Resistance: VWAP often acts as dynamic support for uptrends and resistance for downtrends. It’s like a moving floor or ceiling based on where the actual transaction took place.
Looking at the example of BTC, if the price below the VWAP is $111,080 vs. $111,321 and a strong purchase amount appears as BTC approaches VWAP from below, it could show institutional interest in defending the “fair value” line.
Bonus Read: VWAP + RSI Power Combo
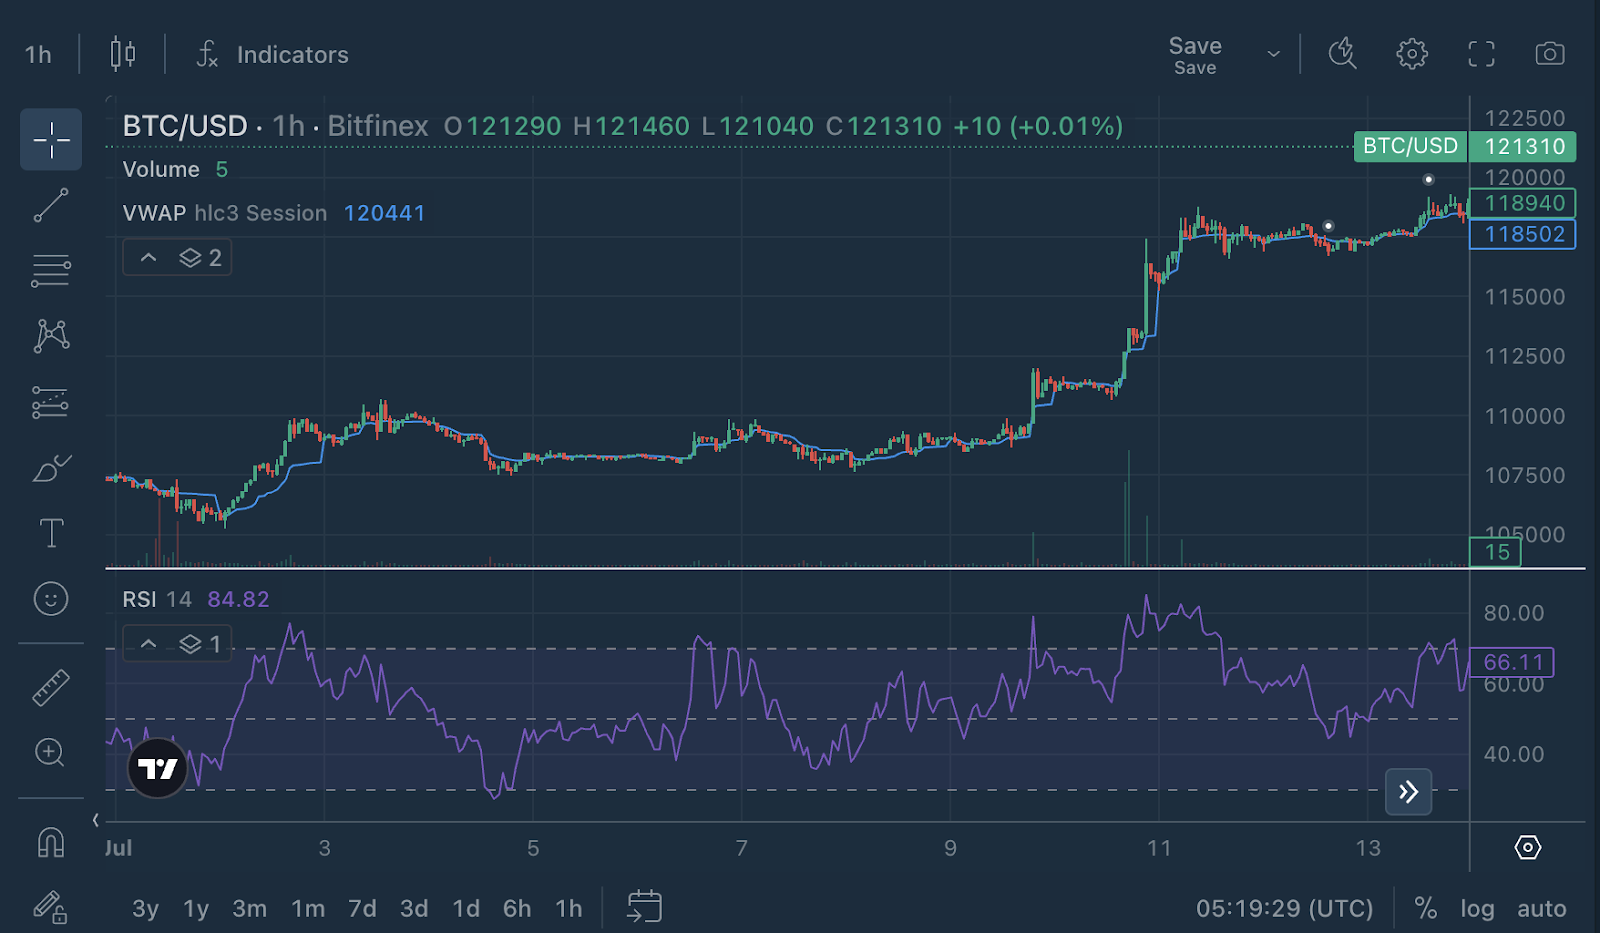
- price: $118,940
- VWAP: $118,502
- RSI: 66.11
This indicates that it contains bitcoin Bullish momentum However, they are approaching the territory they have acquired (RSIs above 70 are usually considered overbuying)
This setup is particularly interesting.
Although the technical indicators are clearly bullish, RSI’s proximity to acquired territory suggests that traders should pay attention to potential pullbacks or integration periods. A VWAP level of $118,502 could serve as a critical support zone if prices decide to retreat from the current level.
Overall, this combination of price action on VWAP and healthy RSI momentum creates a bullish environment for Bitcoin, but the over-conditions approaching suggest that upward movements need to be carefully monitored for signs of momentum fatigue.
Pro tips for using VWAP:
1. VWAP resets daily
Unlike moving averages, which look back on the set count period, VWAP is reset at the start of each trading day. This makes it ideal for day trading and short-term decisions.
2. Don’t fight strong VWAP trends
If prices consistently outperform VWAP with a strong volume, it is often a sign of authentic strength. The market says it is “willing to pay the premium price.”
3. VWAP Touch is golden
When prices drop and bounce to touch and VWAP, they are often a great entry point. The market is testing fair value and finding buyers.
4. Beware of VWAP breaks
If the price exceeds VWAP all day, if it suddenly breaks down with volume, it could indicate a change of emotion. The “fair value” line is violated.
5. Use multiple time frames
- Daily VWAP: Shows Big Picture Fair Value
- Hourly VWAP: Helps accurate entry/exit timing
- Weekly VWAP: Provides a long-term institutional perspective
VWAP Limitations: Things you need to know
VWAP is a powerful tool, but it is important to understand its limitations.
Volume Dependencies: VWAP needs healthy trading volumes to be meaningful. In low-capacity markets or outside of business hours, true fair value may not be accurately reflected.
Keeping behind: During extreme volatility, VWAP can keep up with price movements and may provide outdated information when you need it most.
Short-term focus: VWAP is reset every day and is primarily useful for intraday trading rather than long-term investment decisions.
Not predictive: VWAP shows what happened, not what happened. Don’t assume that prices always return to VWAP. Sometimes the breakouts are genuine and lasting.
Try it with Bitfinex:
- Log in to Bitfinex
- Please select a chart
- Add a VWAP from the indicator menu
- See how prices interact with the VWAP line
- Be aware of the relationship between volume and VWAP
Next, the chart decoder series: How to use Volume and Volume Check to see price action.
Bitfinex. Original Bitcoin exchange.
Discover more from Earlybirds Invest
Subscribe to get the latest posts sent to your email.


