


CryptoQuant’s head of research pointed out how low the demand for absorbing Bitcoin at high prices has been lately, which could explain the asset’s decline.
Bitcoin’s Apparent Demand Indicator Recently Turned Red
In a new post on X, Julio Moreno, head of research at on-chain analytics firm CryptoQuant, takes a different look at recent BTC market trends. “Instead of looking at the distribution and spending of long-term Bitcoin holders, I like to look at the other side of the trade,” Moreno said.
Long-term holders here refer to BTC investors who have held their coins for more than 155 days. This cohort is believed to include “HODLers” with strong market beliefs, so their distribution is closely watched by on-chain analysts.
As CryptoQuant community analyst Maartunn highlighted in another X post, long-term Bitcoin holders have participated in a significant amount of selling over the past month.
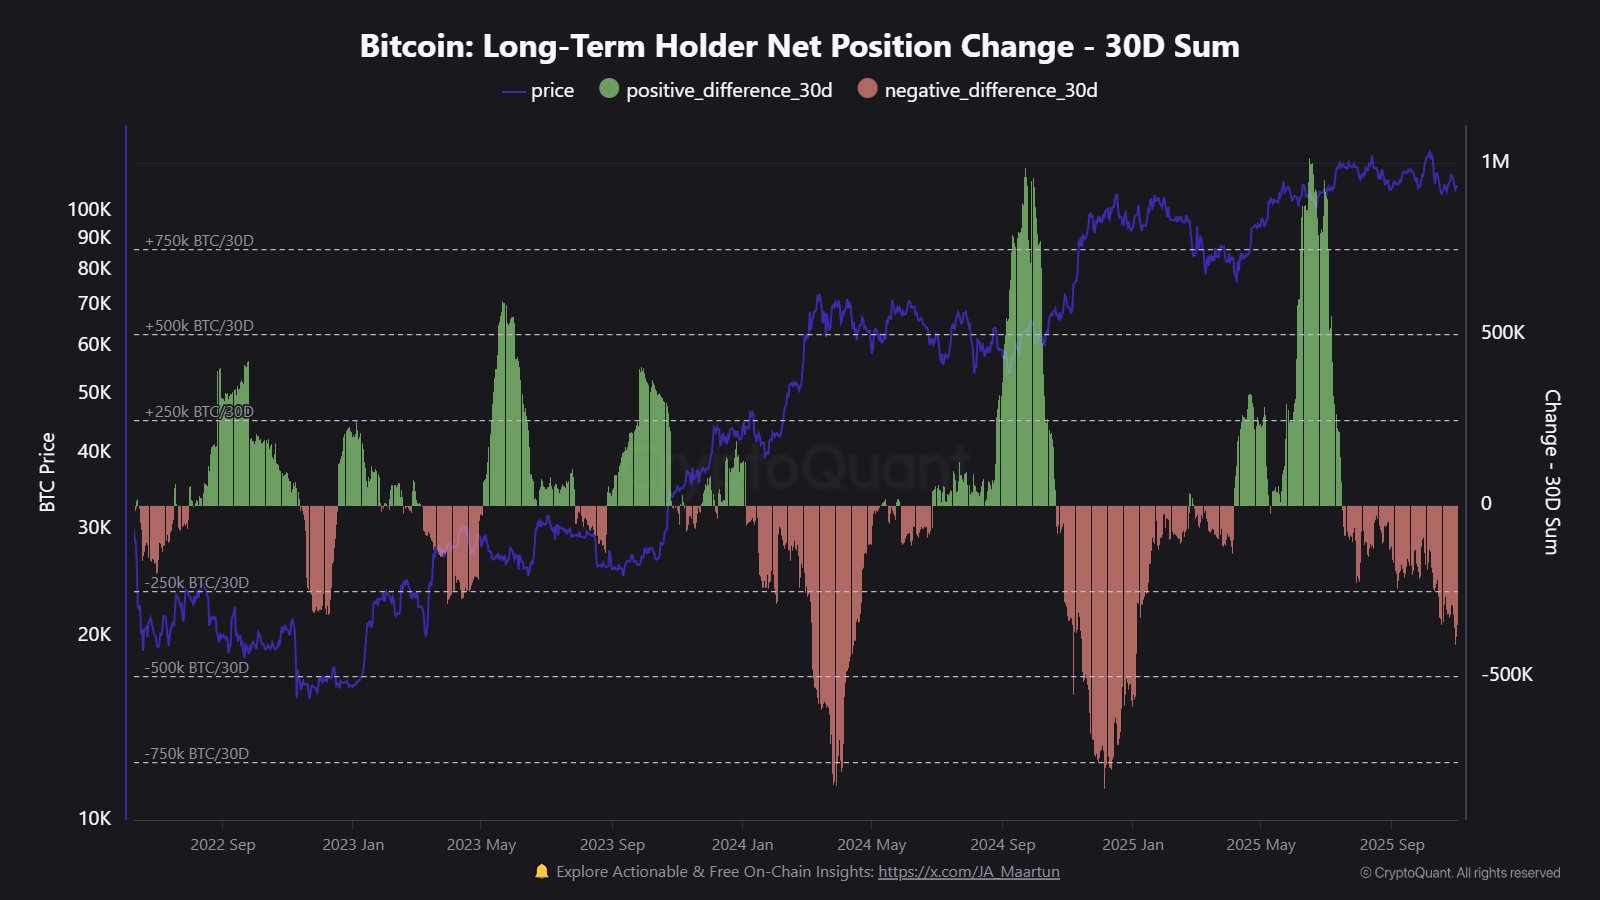
But that’s not what Moreno is focused on. Instead, the head of CryptoQuant checks whether there is enough demand to absorb the supply that long-term holders are selling at a high price.
A useful metric to track this is apparent demand, which compares the difference between BTC production and the change in long-term stock. “Production” is the amount that miners publish on the network each day, and “inventory” is the amount of supply that has been inactive for more than a year.
Here, the chart shared by Moreno shows the 30-day and 1-year trends in Bitcoin’s apparent demand over the past few years.

As shown in the chart above, over the past few weeks, Bitcoin’s apparent demand has been in the red over a 30-day period, suggesting that short-term demand for the cryptocurrency is negative. “Is there enough demand to absorb the supply at high prices?” the analyst asked. “For several weeks now, the answer has been no, and that’s why we’re seeing prices drop.”
The story is a little different when it comes to apparent demand over a year. In fact, while it has seen some growth recently, the pace of increase has been slow and its value remains below its 90-day simple moving average (SMA).
The last time Bitcoin saw an extended period of 30 days of negative apparent demand was during the bear phase in the first half of this year. It remains to be seen whether something similar will happen this time, or whether demand will recover.
BTC price
At the time of writing, Bitcoin is hovering around $103,900, down 9% over the past seven days.
Discover more from Earlybirds Invest
Subscribe to get the latest posts sent to your email.


